As marketers, we are lucky to be living in the era of Big Data. We have more information at our disposal than ever, so the current challenge is being able to properly use and analyze it in order to get to know and impact our audiences better. However, sometimes we unconsciously take mental shortcuts to adjust data to our own wishes or biases. And this can lead to self-satisfactory conclusions, which we need to be wary of. Next we will list the most common fallacies and biases that you should avoid when you map out your marketing strategy.
Data is everywhere and can get overwhelming. By 2025, we’ll have generated 175,000 exabytes of information, which is the equivalent to 175,000,000,000 1TB hard drives. For eCommerce sites, data management is critical to experiment and verify hypotheses, one of the reasons being that well-used data leads to powerful conclusions that can be applied to marketing and sales strategies, making them more profitable with time.
However, human beings have a tendency to manipulate and adjust the information they receive in order to obtain specific results. And most of the time this is done unconsciously. Unfortunately, this goes against the basic principles of experimentation and against the scientific method itself, and it can lead to conclusions based on biased reports.
If you want to avoid experimenting using a fallacy as a premise, we recommend you to go through this 6-point list to find out how your data observations/interpretations can be biased. You’ve probably already made some of these mistakes, as we all do.
Time to take notes!
What is a fallacy?
Before we move onto the list of most common fallacies, let’s look at what “fallacy” really means. A fallacy is a hoax: an apparently valid argument. Fallacies can be very subtle and convincing, and that’s why we need to pay close attention to detect them.
Keep in mind that data is objective (as long as it’s been correctly processed), but interpretations are subjective. And that’s an advantage and a risk at the same time.
We are responsible for the way we choose to interpret figures and metrics. As marketers we choose which data we collect, which metrics we want to estimate and which visualization software to use. But, most importantly, we are the ones who draw the final conclusions that can boost our marketing strategy.
Top 6 fallacies and biases
- Cherry Picking / Selective Attention
Have you heard of the habit of taking a data cluster to make a personal point? What about finding a pattern that fits your hypothesis? Every time someone does this, they’re cherry picking: they’re only selecting the data that confirms their views and ignoring the rest.
This type of observer bias is based on confirming our position by only using the data that supports it, which might sound tempting but is, indeed, quite dangerous.
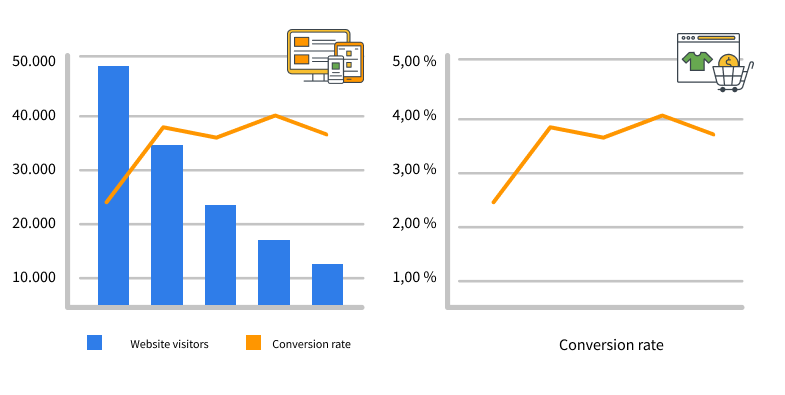
For instance, imagine that a company states that their conversion rate has gone up by 43% over the last year, but omits that website visits have decreased by 73% and orders have dropped by 61% during the same period.
2. Survivorship Bias
Survivorship bias is a logical fallacy based on focusing on the people or things that made it past a selection process and overlooking the ones who didn’t, usually because of a lack of visibility.
This kind of bias can, for instance, lead to overly optimistic beliefs because failure stories tend to be ignored (e.g., excluding the clients we don’t reach from marketing performance reports because they simply don’t get the mailings).
Be wary of this tendency! Drawing conclusions from an incomplete dataset is always risky.
3. False Causality
A false causality is established when we deduct that two or more events are related because of statistical correlation. And correlation does not imply causation!
Variables can be correlated, but this doesn’t imply that one event must have caused the other or vice versa; or even that both variables are caused by a third one. Identifying a false causality from mere correlation would be a fallacy.
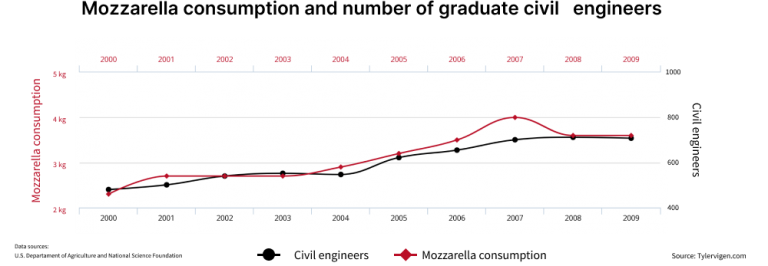
For instance, imagine that two unrelated variables (mozzarella consumption and number of graduate civil engineers) are linked. If we drew a graphic, we could detect a correlation between both of them over the years and reach a conclusion: mozzarella consumption rises when more civil engineers graduate. However, this is an artificial causality, as both events are disconnected from each other. Therefore, a correlation cannot be established.
4. Sampling Bias
This bias takes place when we try to draw conclusions from a dataset that is not representative of our audience. It is related to the precision level we can get when we segment our audiences.
Imagine, for instance, that you want to conduct a survey on brand knowledge for a healthy food supplement that you intend to add to your catalog. If the survey is conducted in gyms, herb shops and eco markets, you’ll only be collecting answers from your target audience.
This could be useful, but results must be cautiously assessed, as sampling bias will be present. We must assume that these groups might know the brand better than the rest of the audience, so the evaluation won’t be neutral.
5. Gambler’s Fallacy
It is the erroneous belief that the probability of an event occurring again in the future is higher/lower because of its frequency. In other words, we assume that past events influence future events.
In the marketing world, this fallacy can have an effect on audience behavioral analysis and on trend predictions.
For instance, if an eCommerce site beats their main competitor during Black Friday sales for three years in a row, it can erroneously be assumed that they will also have a competitive advantage on the fourth.
6. McNamara Fallacy
When non-measurable elements are arbitrarily dismissed. We tend to use this fallacy when we unconsciously follow the following steps:
- Collecting quantitative metrics of whatever we can measure.
- Discarding observations that cannot be measured, or assigning an arbitrary value to them instead.
- Deducting that non-measurable variables are not relevant.
- Thinking that non-measurable events don’t exist.
In short, the McNamara fallacy involves creating an incomplete story which is solely based on easily measurable variables, ignoring the rest of the factors.
Luckily, there are ways to detect it. If you’re working on a product or project and all your KPIs are moving in the right direction but the final result doesn’t improve, you might be a victim of the McNamara fallacy.
Avoiding bias in data analysis
It’s clear that fallacies are a very dangerous trap that can hinder our data analysis, observation and interpretation processes. To avoid them, we must be aware of all the existing biases and take mental notes before we carry out any marketing experiment.
In addition to that, using software that provides trustworthy, granular data (qualitative as well as quantitative) can be crucial. Platforms like Connectif track your contacts’ digital footprint (from anonymous and identified users) to deliver simple, advanced metrics based on reliable big data.
If you are interested in finding out how you can collect valuable big data from your eCommerce site and how to apply it to boost your marketing strategy, request your demo now.